Ocean swells are generated by storms blowing at sea, far from
A swell arriving in
As swells appoach shallower water, they slow down and bend to become more nearly parallel to the shoreline. This is called refraction. It can cause wave energy to be focused on some areas, such as points of land, and cause wave energy to be lessened in other areas. Also, as waves refract and bend around small islands or shallow areas, they may interact on the side away from the swell direction, and may cause large waves to develop there.
The combination of these factors, dispersion, wave interference, and
refraction, lead to complex patterns in which wave height in
The image shown here is the
There are a number of important features to notice in the image shown above.
First, notice that the wave height is indicated in various colors, and
that a color scale at the lower part of the image shows what colors correspond
to which wave heights. Second, there is a semi-circular diagram in the
left part of the image which shows, graphically, the direction and period of
the swell or swells approaching
Notice the high waves along the northwest sides of some of the offshore islands.
How large are these waves? (Please indicate the height in feet.)
Why are the waves so large in these locations? (Refer back to the introduction if you need to.)
Now examine the
How large are those waves?
Click here to continue with exercise.
Click here to return to the lab exercise outline.
The graph shown below shows predicted wave height along the Southern
California coast, from north of Point Conception, west of
Where are the waves highest?
What height (in feet) are they predicted to be?
How do you explain the waves being highest in that location? (Note: you may want to refer back to the previous image in order to answer this question.)
Click here to continue with exercise.
Click here to return to the lab exercise outline.
The image shown below is portion of the Southern California Swell
Prediction, this one covering only the
Where along the coastline in
How high are they predicted to be?
Click here to continue with exercise.
Click here to return to the lab exercise outline.
The graph shown below is a portion of the coastal wave height prediction. Examine it and answer the questions below.
Where will the waves be highest along the coastline in
Where will they be lowest, and how small will they be?
Which of these places would you pick to go surfing?
What factors, other than wave height, might you consider before you put your surfboard into your car and head for the beach? (Think of everything you can, including possible non-oceanographic factors.)
Click here to continue with exercise.
Click here to return to the lab exercise outline.
The image shown below is one from July when there was a strong south swell. Examine it and compare it to the Southern California Swell Prediction which you examined at the beginning of this lab exercise. Then answer the questions below.
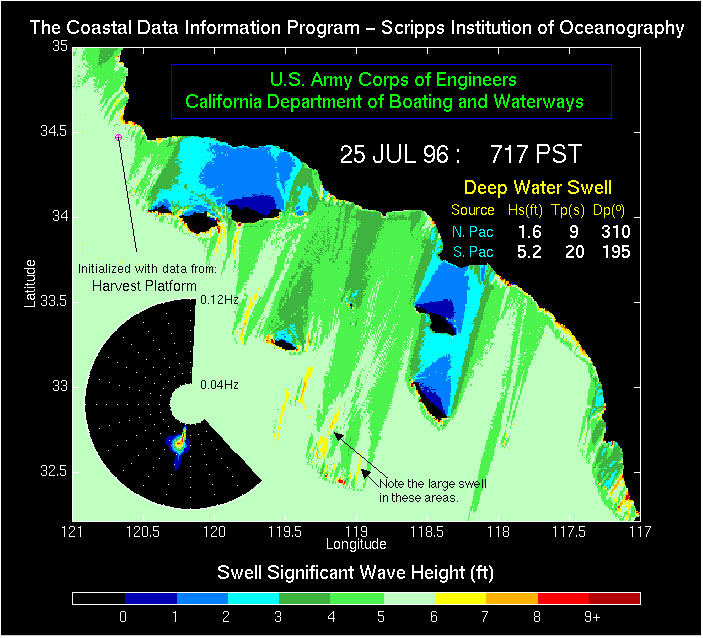
Compare the size, direction and period of the south swell to that which we viewed at the beginning of this lab, and describe where the waves are larger during the south swell, and where they are smaller compared to the data set we viewed earlier.
Notice the area of large wave size near 32.5 degrees north, 119 degrees west (indicated with arrows on the image). These areas of large swell are immediately northeast of shallow areas of the seafloor known as Cortes Bank and Bishop Rock. How do you explain these areas of high swell? (Note: you may want to return to the Introduction to refresh your memory.)
Click here to continue with exercise.
Click here to return to the lab exercise outline.
Examine the image shown here, and answer the questions below.
Describe how the swells on this date are different from the images we saw earlier.
Click here to continue with exercise.
Click here to return to the lab exercise outline.
The image below is a swell prediction from December 11, 1996, based on data
from a buoy located in the
Where are the largest waves predicted to be striking the shoreline, how high will they be, and what is their period?
How do these values compare to those we observed from December 3 in
Click here to continue with exercise.
Click here to return to the lab exercise outline.
Finally, let's consider the latest swell prediction for
What is the date and time of the swell prediction?
What is (or are) the swell direction(s), period(s) and heights?
Where along the shoreline are the waves expected to be largest (give the latitude and longitude), and how large are they expected to be?
Will the surfing be any good in the